
Two flags and a fortnight: getting Gemma 4 31B to fly on Intel Arc Pro B60s
We put about ten grand of Intel Arc Pro B60s into a box to serve models at fixed cost instead of paying per token. Here’s what actually made it faster, what didn’t, and the three things in Intel’s software stack that are still leaving performance on the table.
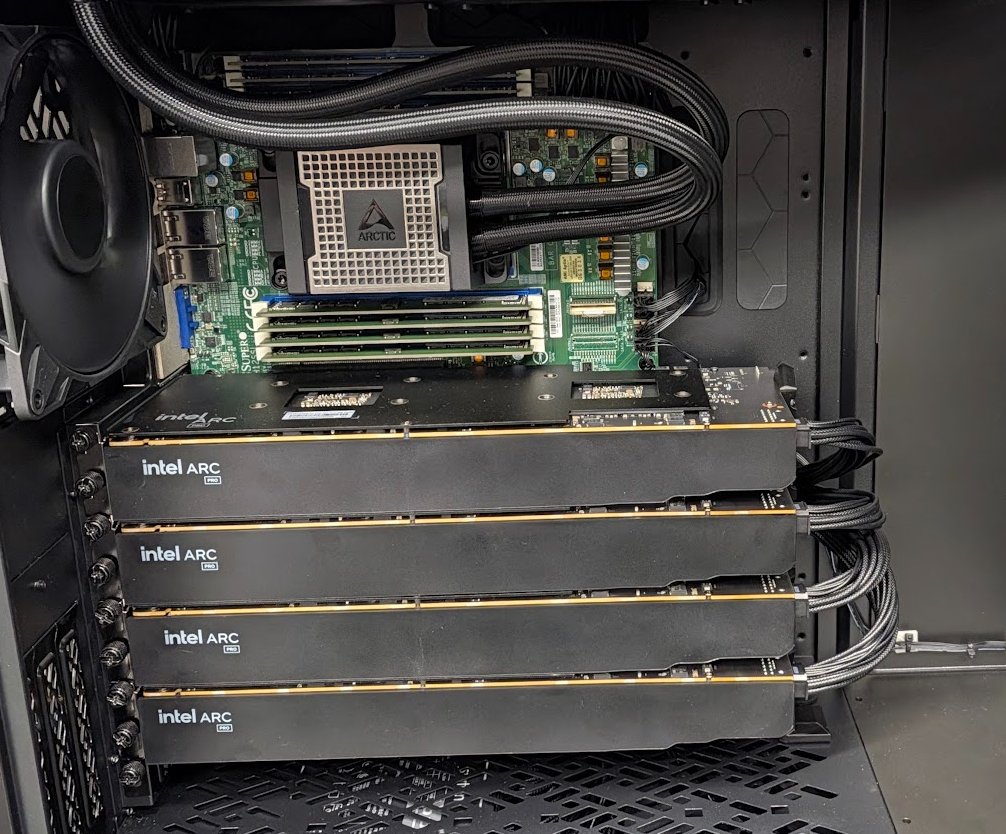
The hardware is eight Intel Arc Pro B60s as four dual cards, 24 GB per die (192GB VRAM) with a single-socket EPYC 7402 with 128 GB of RAM, running Proxmox. The job is serving Gemma 4 31B for a handful of internal workloads: an IT support chat, company chatbot with solid MCP / tool calling with Hermes Agent, some CSV drift analysis and some other automated tasks. We need vision and audio, which rules out a lot of otherwise faster models.
We tested somewhere north of twenty configuration levers over a couple of weeks, in the end two of them mattered. I’m going to spend most of this post on the eighteen that didn’t, because that’s the part nobody writes down and it’s the part that would have saved us the most time.
The two that worked
1. --dtype float16
We ran bfloat16 for the entire project without ever questioning it. It’s the sensible default, Gemma is trained in bf16, and nothing in vLLM suggests otherwise.
Then we actually read Intel’s own reference command for Gemma 4 in the llm-scaler repo. It uses float16. One word. We’d walked past it for a fortnight.
| Metric | bfloat16 | float16 | Change |
|---|---|---|---|
| Cold prefill, 16k tokens | 243 tok/s | 376 tok/s | +55% |
| Single stream | 11.2 | 12.5 | +13% |
| Time per output token | 89 ms | 79 ms | −12% |
| Throughput @ 16 concurrent | 135 | 135 | nil |
We checked it wasn’t costing us quality. fp16 has a much narrower exponent range than bf16, and overflow shows up as subtly worse answers on hard prompts while trivial ones stay perfect. So we ran a 12-check objective suite — exact word counts, JSON schemas, character counting — against the bf16 answers. Identical: 12 out of 12 both ways.
2. MTP speculative decoding
This is the big one, and it took three attempts to get running — all three failing for a reason that had nothing to do with the model.
The --speculative-config argument takes JSON. We were passing it through ssh → pct exec → bash -c, and it lost a layer of quoting every hop. vLLM received {method:gemma4_mtp,...} with the double quotes stripped and rejected it as unparseable. It looked exactly like “MTP isn’t supported on XPU”. It was a shell quoting bug. The fix is to write the JSON to a file and point at the file, so it never goes near a shell.
| Draft tokens | Single stream | @1 | @16 | Mean accepted |
|---|---|---|---|---|
| off | 12.77 | 12.68 | 147.9 | — |
| 2 | 25.04 | 17.80 | 172.1 | 2.61 / 3 |
| 4 | 30.08 | 19.92 | 176.7 | — |
| 6 | 27.50 | 16.88 | 133.1 | 2.96 / 7 |
| 8 | 27.98 | 15.98 | 126.5 | 3.58 / 9 |
Single-stream generation went from 12.77 to 30.08 tokens a second. Two and a half times, and it’s lossless — the main model verifies every token the draft model proposes, so the output is identical to what you’d get without it. There’s no quality trade to argue about.
Four draft tokens is the sweet spot, and the last column shows why. However many you draft, the average number actually accepted saturates around three. Draft eight to land 3.58 and you’ve thrown away more than half the work, which is why throughput at 16 concurrent drops below the no-speculation baseline at n=6 and n=8.
Put those two together and a 31B dense model does 30 tokens a second on a single stream. An NVIDIA DGX Spark on my desk does 30.3 on a 26B model with 4B active parameters. Same speed, roughly eight times the actual computation per token.
The eighteen that didn’t
This is the useful bit. Everything below was tested properly against a measured noise floor, and none of it helped.
| Lever | What happened |
|---|---|
Removing --enforce-eager | Emits fluent garbage. “What is 2+2?” → “CC? prestig l l- ? la l l uma lS”. Healthy container, no error, full speed. |
--kv-cache-dtype fp8 | Doubles the cache, halves throughput at 16 concurrent, doubles time to first token. |
--max-num-batched-tokens 32k/64k | Eats the memory your context needs. Drops the usable context ceiling to about 40k. |
| Pipeline parallelism | 4×1 and 1×4 won’t even start. 2×2 starts and costs 58% of throughput. |
--block-size 128 or 256 | Nothing. |
--gpu-memory-util 0.95 | Worker init fails. 0.9 is the ceiling. |
CCL_ZE_IPC_EXCHANGE=drmfd | Kills the engine. pidfd works and does nothing. |
| AWQ 4-bit weights | Slower than FP8 despite reading 40% fewer bytes. No native 4-bit path on Arc, so the dequant costs more than the bandwidth it saves. |
| Six BIOS settings | ACS off, DF C-states off, TSME off, the lot. Performance-neutral. Worth doing for stability, not speed. |
The trap that cost us the most
Four of the environment variables we were handed as fixes don’t exist in this build. VLLM_ATTENTION_BACKEND, VLLM_XPU_ENABLE_FP8, VLLM_USE_V1, VLLM_RPC_TIMEOUT — zero hits in envs.py, which defines 265 variables. Intel’s llm-scaler is a fork of an unreleased vLLM, and flags move.
Setting a variable the software doesn’t read fails silently. You benchmark it, see no change, and conclude the optimisation doesn’t help on your hardware. That’s a wrong conclusion you then act on. We burned real hours on this before writing a five-second script that greps envs.py before we benchmark anything.
--block-size 128. It wasn’t. The baseline had been a bad run — the same config measured later at less than half speed, once, unreplicated. We then “corrected” it to the memlock ulimit, which was also wrong. Both were noise. After that we started every sweep with two byte-identical reference runs to establish the actual noise floor, which turned out to be about 1%. Anything under 3% isn’t real.Three things Intel needs to fix
This is competitive hardware with an underdeveloped software stack, and you can put numbers on it.
No MoE kernel for Intel GPUs
vLLM’s selectable MoE backends are triton, deep_gemm, cutlass, the flashinfer family, marlin, aiter, flydsl. Every accelerated one targets NVIDIA or AMD. One is named explicitly for the DGX Spark. There is no Intel option, so auto falls through to generic Triton.
The result: our 26B mixture-of-experts model runs at roughly 3.8% of its memory bandwidth roofline at single stream, while the 31B dense model on the same box manages 27%. That’s an eight-fold gap that exists only for MoE models.
We tested whether it was a communication problem rather than a compute one by enabling expert parallelism, which distributes whole experts across GPUs instead of slicing every expert across all of them. It made things worse: throughput at 16 concurrent dropped 23%, and time to first token went from 3.9 to 11.4 seconds. The gap is in the expert compute kernel, and no configuration we have reaches it.
No flash attention kernel for prefix-LM
Gemma 4 uses bidirectional prefix-LM attention and there’s no flash implementation for it on Intel, so every start logs “Falling back to Triton Attention backend”. You can force flash on, and it’s worth about 23% — but it silently produces wrong results for image and audio input, which is the whole reason we chose this model. So it sits unused.
The kernel bug that eats your RAM
This one’s genuinely nasty. Host RAM consumption tracks VRAM allocation one for one. We measured 117 GB of system memory consumed for 95.7 GB of VRAM, and none of it shows up in ps, free, or any normal counter — it’s held kernel-side by the xe driver.
Practically, a 144 GB VRAM box needs 144 GB of host RAM just to use the GPUs you’ve already paid for. We’ve got 128. It OOM-killed a VM, wedged the GPU driver hard enough to need a power cycle, and took us two days to find because it’s invisible to every tool you’d normally reach for.
There’s a patch on the kernel mailing list for it — “drm/xe: Fix unnecessary host-side population of ttm_tt on non-TT resources”. The author tested with vLLM on six Arc Pro B70s and got 115.84 GB down to 15.34 GB. Nearly identical hardware and nearly identical numbers to ours. It’s still pending review.
The config
This is what we run. The comments are the ones that matter, not decoration.
services:
  gemma4:
    image: intel/llm-scaler-vllm:0.26.0-b1
    container_name: gemma4
    restart: "no"          # crash-loops hide the failure; let it stay down
    init: true             # reaps killed workers - without this an OOM-killed
                           # worker becomes an unkillable zombie holding a DRM
                           # lock, and wedges the driver for the whole box
    network_mode: host
    ipc: host
    shm_size: 32g          # default 64MB will hang multi-GPU tensor parallel
    privileged: true
    devices:
      - /dev/dri:/dev/dri
    ulimits:
      memlock: {soft: -1, hard: -1}    # oneCCL pins memory for its fabrics
      stack:   {soft: 67108864, hard: 67108864}
    volumes:
      - /models:/models:ro

    environment:
      # These four are mandatory. Drop any of them and tensor parallel
      # produces fluent garbage at full speed with a clean startup log.
      - ZE_AFFINITY_MASK=0,1,2,3
      - CCL_TOPO_P2P_ACCESS=1
      - VLLM_WORKER_MULTIPROC_METHOD=spawn
      - VLLM_ALLOW_LONG_MAX_MODEL_LEN=1
      # Default is 300s. A long cold prefill exceeds it and the engine
      # dies outright, so one big request takes the server down for everyone.
      - VLLM_EXECUTE_MODEL_TIMEOUT_SECONDS=3600

    command:
      - '/models/gemma-4-31b-fp8-dyn'
      - '--tensor-parallel-size'
      - '4'
      - '--dtype'
      - 'float16'                    # +55% prefill over bfloat16
      - '--block-size'
      - '64'
      - '--gpu-memory-util'
      - '0.9'
      - '--max-model-len'
      - '262144'
      - '--max-num-batched-tokens'
      - '8192'                       # raising this eats your context ceiling
      - '--enable-prefix-caching'
      - '--enforce-eager'            # NOT optional - see below
      - '--speculative-config'
      - '/opt/vllm/mtp.json'         # read from a FILE, never an env var
      - '--enable-auto-tool-choice'
      - '--tool-call-parser'
      - 'gemma4'                     # NOT gemma4_engine - that's the filename
      - '--reasoning-parser'
      - 'gemma4'
      - '--host'
      - '0.0.0.0'
      - '--port'
      - '8000'
And mtp.json:
{"method":"gemma4_mtp",
 "model":"/models/gemma-4-31B-it-assistant",
"num_speculative_tokens":4}--enforce-eager: we were told three separate times to remove it, on the grounds that it’s a VRAM trade-off and we had memory to spare. It isn’t. vllm::all_reduce aliases its input, which breaks PyTorch’s custom-op contract, so compiling the graph corrupts the output at tensor-parallel sizes above one. It has nothing to do with free memory and everything to do with whether your model produces English.What we’d tell you if you’re buying these
The silicon is fine. Four B60s give you 1,824 GB/s of aggregate memory bandwidth against the DGX Spark’s 273, and on dense inference we now match the Spark’s tokens per second while doing roughly eight times the computation per token. For fixed-cost internal serving, that maths works out well.
The software is where you’ll spend your time. Budget for it. Two of the three gaps above have an obvious fix that just hasn’t landed yet, and the third — the MoE kernel — is an eight-fold difference sitting there unclaimed. If you’re running mixture-of-experts models specifically, wait or pick different hardware, because right now Arc runs them at a fraction of what the memory bandwidth should allow.
We’re going to have a crack at some of the kernel work ourselves once we’ve got a spare pair of cards free. If that turns into anything, we’ll put it upstream and write it up.
All figures were measured on our own box against a 1% noise floor, with correctness gates on every configuration before any performance number was recorded. Happy to share the test harness if it’s useful to anyone — it’s all shell and Python, and it caught five measurement artefacts that would otherwise have gone into this post as findings.